| My Bike Racer levels page popped up suddenly around August of 2013 when I moved to Boulder. When I moved here I looked out of the window and saw the Flatirons and decided that I wanted to get into Mountain Biking and Triathlon Culture, but before I actually participate myself I want to make a web page for it so that it is interesting to me as well as beneficial to society. .
I have created 100 different speed levels over nine time/distance categories, as well as climbing and combined levels with a total of 11
level categories.
The speed categories are displayed by results in real time trials, triathlons and strava rides that correspond to their respective distance categories. The rider is attached to a speed category by what their average speed is in a race of a distance that is within the range of it's level. With this method, you can compare riders from different time trials as if they were in the same time trial. You just need to make sure that the course you are using is flat and fast so everybody in the list is at relatively the same advantage. I list what race they are in and what division they are so the levels of the divisions can be determined with my Category Level Chart. Some other charts I have are a passing speed chart that is a cross chart that shows how fast people of each category pass each other, the pulling and drafting chart, which shows the percentage of drafting and pulling various levels of riders would do when they ride with each other in groups of two, the fade chart which shows the levels of each distance for a particular rider, the rider type chart which shows the weight range of riders showing the advantages and disadvantages of the heavy vs light riders, the weight carry chart which shows how much of the slower person's weight the faster person would have to carry in order to be at the same speed, and the fluid trainer speed chart which shows how fast someone is going in real life on a triathlon bike according to how fast someone is going on a Fluid Trainer.
In order to make the bike riding experience even more interesting, I have created a map to show 100 speed levels of eight distances and Riding Times so that people can guage their progress and decline throughout their life long bike racing carreers. The Bike Racer Levels page doesn't just increase interest in cycling, it also helps people become better cyclists. If you know how good all of the riders are, then it is easier to put appropriate teams together for big rides and races. It also helps people determine how talented they are because it displays how good various types of cyclists are with specific names attached to each level that people can research and find out the talent range because you will read of someone who did very well after a short time training or another person on the other side of the spectrum who trains all the time for years and can only reach a certain level. The levels page is supposed to help the non talented as well as the talented. It helps the talented because it incourages people. It helps the non talented because it shows them how much they need to ride in order to get to a level they want to get to, and to be realistic. When you know how good you are not, it is easier on your ego to be as bad as you are because you know you are not alone.
Different people are talented at different distances and it is interesting to study why and how different people in the pack perform differently between the different distances. Sometimes a person's riding talent is a result of their genetics and sometimes it is a result of their training.
How the Bike Racer Levels Page works
The Bike Racer Levels Pages are to standartize all of the time trials and divisions to create a clear representation where everybody is in the pack. Because people's speeds change throughout the ride, there are 10 Time/Distance Categories, but the base level by which we simply define a racer's level is the One Hour/40Kilometer/25Mile one because it represents a typical ride. The 20 Minute one is almost as important because it represents a typical commute as well as the typical distance of a time trial for juniors and women. When people talk about someone's FTP it seems like about half the time they are talking about the 20 minute one. People are not good at distinguishing which one they are talking about so you have to guess which one it is based on who they are and what is realistic.
Riding Conditions
The level of a persons road riding is divided into eleven Riding Conditions, which include nine Time/Distance and three climbing levels, with the benchmark being the one hour represented by 40 Kilometer Time Trial. I like making the times and distances of the different racing time levels increase in a symetrical way in order to keep it simple, even though riders decrease speed as miles increase which more than doubles time.
Kreuzotter Calculor
I don't know how they did it, but the Germans have created the Kreuzotter page, which scienfically calculates a riders level by entering every important variable within reason pertaining to the bicycle and the rider. With this tool all you need is someone's Flat Time Trial time and the kind of bike they used then you know what rider level they are on the flats. If you know their bodyweight then all you have to do is enter 8.11% to the climb field and you know their L'alpe D'huez climbing speed and then can calculate your time on my Climbing Level page or Climbing Time trial page.
Determining my Bike Racer Levels throughout my Bike Racing Career
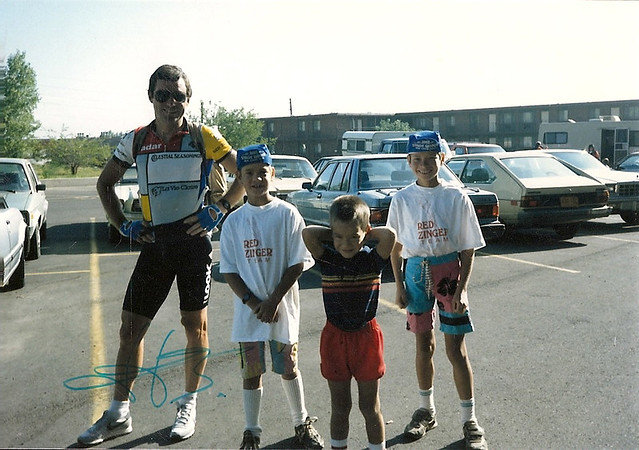
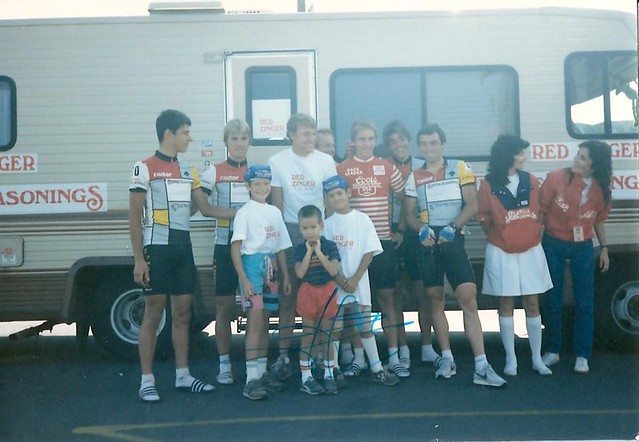
I never timed myself or went to any Time Trials as a kid. I was more of an adventure Mountain Biker. I guess I was around mid pack. I raced the Red Zinger Mini Classic stage race around Boulder four times from 1984-87 and then was strictly a Mountain Biker. I was 16th in '84, 8th in '85, 18th in '86 and 25th in '87. Even though I could have done it two more years I quit racing the Red Zinger after I was 13 because I developed a knee disease called Osgood–Schlatter and was told to stop riding hard. I was also told to quit running and Nordic Ski Racing. I was on the 7th grade track team and didn't run again until 12th grade cross country. I don't think it was necesary for my knee to quit Ski racing but I didn't mind it because my brother did it too and I knew how expensive it was for my parents. I went to physical therapy a couple times a week one year when I was like doing ultra sound on the sore lump under my knee. I like to believe that because I took those precautions I will have healthy knees for when I start riding my bike again.
I was a Mountain Bike racer until through the 1991 summer when I was 17. I didn't do any group rides during that time so it's hard to guess what level I was. I did four Licensed Junior races in '90 or '91 I can't remember which, and I think I got last or second to last place in all of them, I think because I didn't have leg speed because they started off really fast and it was over for me immediately. On a good day I was a pretty good mountain biker though so for this chart I will classify myself growing up as the average for a boy of my age. I have a thin build so maybe a little above average on the climbs and a little below average on the flats to keep it simple.
The first time I timed myself on anything was in 2008 when I did the Lyons to Boulder Time Trial, but I wasn't in riding shape. I was only riding about once every couple weeks and I couldn't feel my legs which is a guage on whether or not i'm in "riding shape". My time was 33:09 I think which was dead last for the men and I think I beat like three or women. I think that put me around the top of fast commuter where you would expect me to be having not been regularly training.
The 25 Mile Per Hour speed range consists of 10 categories that increase in speed from 8 to 33 miles per hour in increments of 5, 3.75, 3, 1.25, 2, 2, 1.25, 1.25, 2.5, and 3. Three miles per hour is the maximum difference in speed that riders can have and be riding partners because drafting reduces 30% of watts needed to maintain a certain speed which is how much less watts you would need to reduce your speed by three miles per hour, so if a 27 mph rider is on a ride with a 24 mph.
Plus there's (Wikipedia):
Eddington number for cycling
Eddington is credited with devising a measure of a cyclist's long-distance riding achievements. The Eddington number in the context of cycling is defined as the maximum number E such that the cyclist has cycled E miles on E days.
For example, an Eddington number of 70 miles would imply that the cyclist has cycled at least 70 miles in a day on at least 70 occasions. Achieving a high Eddington number is difficult since moving from, say, 70 to 75 will (probably) require more than five new long distance rides, since any rides shorter than 75 miles will no longer be included in the reckoning. Eddington's own life-time E-number was 84.
The Eddington number for cycling is analogous to the h-index that quantifies both the actual scientific productivity and the apparent scientific impact of a scientist.
The Eddington Number for cycling involves units of both distance and time. The significance of E is tied to its units. For example, in cycling an E of 62 miles means a cyclist has covered 62 miles at least 62 times. The distance 62 miles is equivalent to 100 kilometers. However, an E of 62 miles may not be equivalent to an E of 100 kilometers. A cyclist with an E of 100 kilometers would mean 100 or more rides of at least 100 kilometers were done. While the distances 100 kilometers and 62 miles are equivalent, an E of 100 kilometers would require 38 more rides of that length than an E of 62 miles. |